
I’ve expounded my preference for “next-gen” research methods on LinkedIn for quite some time now. While I’m hesitant to call all of them a panacea for modern research, I do think many represent where the industry is heading and what “traditional research” will be thought of in 20 years (maybe less).
My career in market research started while the industry was still fairly cloistered off in what are now thought of as “traditional research methods” (i.e. surveys and focus groups). Although that wasn’t all that long ago, terms like “big data” and “machine learning” were not in heavy rotation in the lexicon of industry jargon. Now market research and data analytics are becoming two sides of the same coin and this is opening up a wealth of new possibilities and opportunities to the industry — for those that are ready to adapt, learn, and grow their skill sets.
Neuromarketing: Still a Work In Progress, but a Step In the Right Direction
I once took a tour of a neuromarketing facility at a major research firm. The “lab” was actually quite impressive. Participants (although it seemed like “patients” might have been a more suitable choice of titles) were fitted with a fMRI headpiece that scanned their brain activity while viewing content on a television screen in a darkened room. These measurements were then used to determine if the viewer was getting the desired reactions on a “frame-to-frame” basis (i.e. brain activity measurements were captured alongside the real-time video stream). Based on an aggregate of participants’ reactions to the same content (usually a commercial) recommendations could be made for improvements such as reworking places not eliciting the desired reaction, places to cut completely, and even reworking the entire ad spot.
It was an enlightening tour but the business never seemed to take off. The high investment in a new, unproven, and questionably validated technology probably made most clients hesitant to stray from more traditional methodologies (although those are faced with their own issues that most people seem not to consider). Yet nevertheless, I believe this “passive,” nonconscious measurement is where the market research industry is headed. Indeed, research buyers maybe ASKING for these methods according to one data source.
Now there are resources available that could potentially compete with neuromarketing’s emotively-derived measurement…and for all intents and purposes, freely.
(Free) Tools We’ll Be Using
Most of the time client-side researchers believe that only large research suppliers have the resources to use these next-gen techniques. However, this isn’t always the case. One of the main messages of Expected X is that there exists a wealth of free data and tools out there if you know where to look.
Today I’m going to offer a technique for mimicking neuromarketing’s ability to capture and measure emotion across time while viewing an ad. Here are the tools we’ll be using and links to their respective websites for further details that I’ll abstain from getting into in this post:
- R is one of the most widely used open-source, statistical programming languages today. It is highly extensible and allows users a variety of analytical techniques including connecting to third-party machine learning tools like Emotion API
- Microsoft’s Emotion API provides a means of quantifying human emotions captured in still images and video. The tool is still in “Preview” stage so it isn’t perfect and it also shouldn’t be used as a single means of data capture (which goes for any methodology)
- Bandicam is a simple program for recording on-screen content and webcam video simultaneously
Nonconscious Measurement with Microsoft Cognitive Services
Ads of the video variety run on both television and the Internet, across several devices. Combined, both of these channels compose more than 2/3 of all ad spending — digital slightly surpassing television for the first time (not all digital is video, however). Understanding consumer reactions to ads is important for a number of reasons. Here are three examples:
- Removing non-contextually important ad content that does not elicit the desired reaction from the consumer
- Generating the correctly-intended emotional response
- Grabbing consumer attention when an ad is presented among other competing content
Typical ad testing is done through direct questioning of respondents to measure things like recall and retention, but survey methodology can provide an inaccurate portrayal of reality. What if, instead, you could “read” a person’s emotional reaction to your ad while they watch it in real-time and in a realistic setting? After all, actions speak louder than words, right?
For this demonstration, we used a commercial from the Los Angeles Film Festival shown below. Participants were asked to download the Bandicam software and install it on their webcam-enabled computer. Given a set of simple instructions, the software is ready to record the participant’s face while they watch the advertisement. This process can also be done en masse with the researcher providing several participants the necessary webcam/software setup simultaneously, in-person.
Microsoft’s Emotion API is part of its Cognitive Services Suite of Machine Learning algorithms. These are the same set of tools that were publicized as part of the company’s “How Old Do I Look?” app which unfortunately received a lot of media flak for incorrectly guessing a lot of people’s ages. However I think it’s fair to say that people can age differently — I, myself, have frequently been mistaken for being in my early to mid-Twenties when in actuality I’m 33 (thank you for the good genes, Mom and Dad)! Emotions, on the other hand, transcend age — a smile is a smile and a frown is a frown whether you are 18 or 80.
Emotions also transcend other demographics like race, gender, and culture/ethnicity, however, keep in mind that the triggers for these emotions are not universal (i.e. what one culture finds funny might not be so funny in another such as the use of sarcasm). This is actually really useful when ad testing cross-culturally.
The Emotion API identifies eight emotions: happiness, sadness, surprise, anger, fear, contempt, disgust or neutral. Both still images and video can be passed to the API and each can include multiple faces as the algorithm is capable of distinguishing different people in the frame (think of the autofocus on your camera). We will only use videos with a single participant being captured for this demonstration.
As I mentioned earlier, the Emotion API is still in “Preview” stage so it isn’t without bugs (hopefully Microsoft will continue to improve the algorithm — which isn’t well documented exactly what that algorithm is but I’d assume some sort of neural network). To help with this, we embed the ad being tested within a group of other video clips designed to elicit each of the eight emotions the API captures. While everyone sees the same eight clips plus the tested ad, we randomize the order and placement of the test ad within. This is intended to create a baseline for participants’ emotions that can be used to adjust the measures we capture from the test ad.

The images above help provide an emotion “baseline” for the test ad. From left to right, they are intended to elicit Happiness, Disgust, Sadness, and Surprise. Some video clips we use may be considered “Not Suitable For Work” but it’s necessary to garner the reaction we desire.
After capturing each participant’s video, we feed them into the Emotion API via R of which the technical details are beyond the scope of this post. The videos are then evaluated frame-by-frame and a score is given for each of the eight emotions. These scores are normalized meaning that for each frame in the video the scores across the eight emotions sum to 1. The emotion with the highest score is what the algorithm predicts as the participant’s emotion at that frame in time. This way we can track emotions across the entire test ad.
Analysis and Applications of the Emotion API
We aggregate participants’ scores (weighted by the baseline measures) over the course of the test ad to determine a few important insights based on the three bullet points I mentioned above (these apply to all ads and not just the demonstration test ad which I’ll talk about after):
- Are there any parts of the ad that aren’t eliciting an emotional response (i.e. mostly “neutral” emotions detected)? Unless these parts add specific context to the ad, they might be considered “dead space” and could effectively be edited out without loss to the overall message and meaning.
- Are there any parts of the ad that elicit a different emotion than what was intended? For example, the Nationwide Super Bowl ad about a young boy’s death was indeed intended to catch viewers by surprise, but considering its placement during the largest sporting event of the year (an otherwise “happy” social time unless your team happens to be losing) it may have elicited more anger than was intended.
- In the online video ad world where consumers can be bombarded by ads, standing out means capturing attention quickly. If emotions like “surprise” aren’t elicited with immediacy, then the ad may blend into the background when used in the real world.
For the most part, it seems that Emotion API is doing a decent job of detecting emotions in people’s faces. Shown below are frame-in-video captures during participant testing. The stacked bar chart shows the proportions of the emotions detected in that frame (remember they’re normalized) with the biggest proportion indicating the most likely emotion.
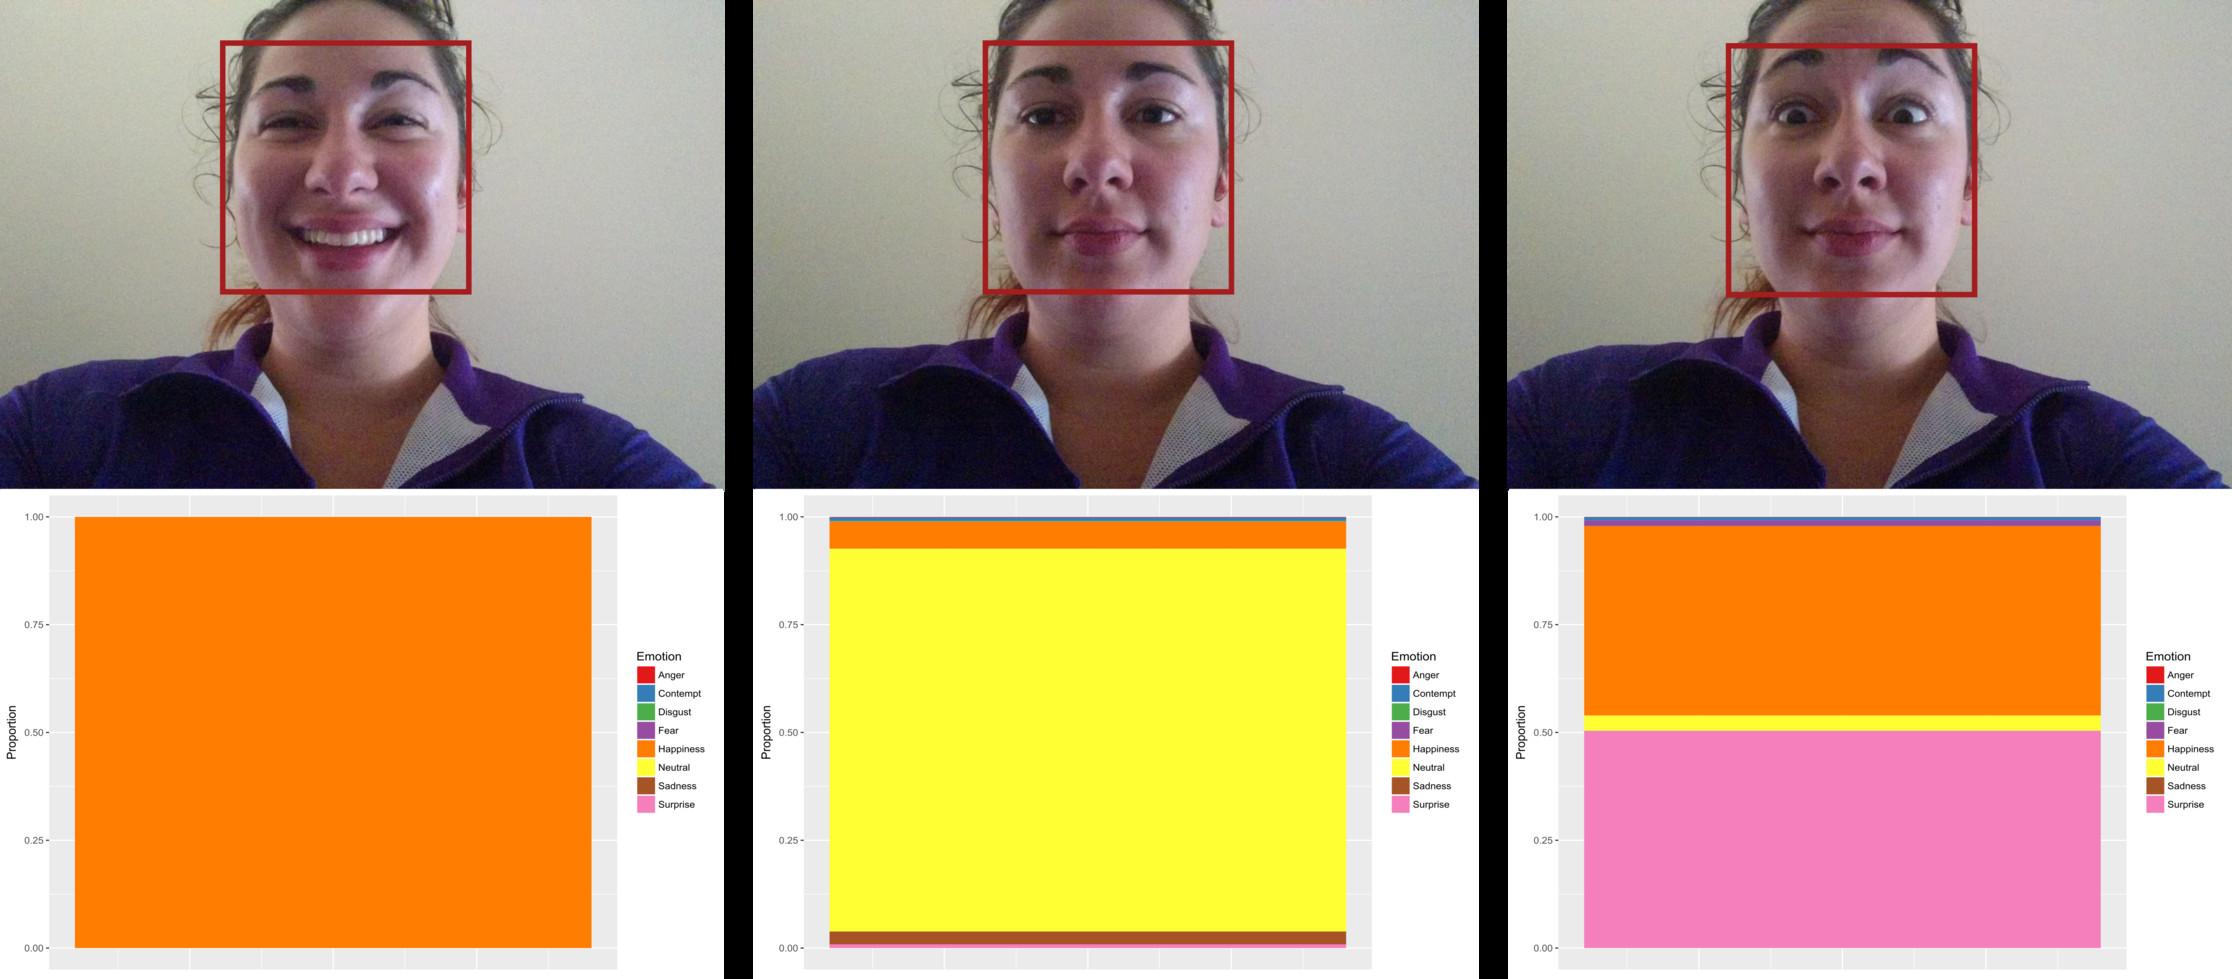
Left to right: 1) Sometimes there is no doubt in the algorithm’s “mind” — this is ~99% happiness with other scores too small to see; 2) Other times it isn’t a complete victory for one emotion; 3) “Surprise” has the highest proportion, but only slightly higher than “Happiness”
Calculated over the length of the ad (which is approximately 1:01 minutes) we get a picture of how participants’ emotions change while watching.
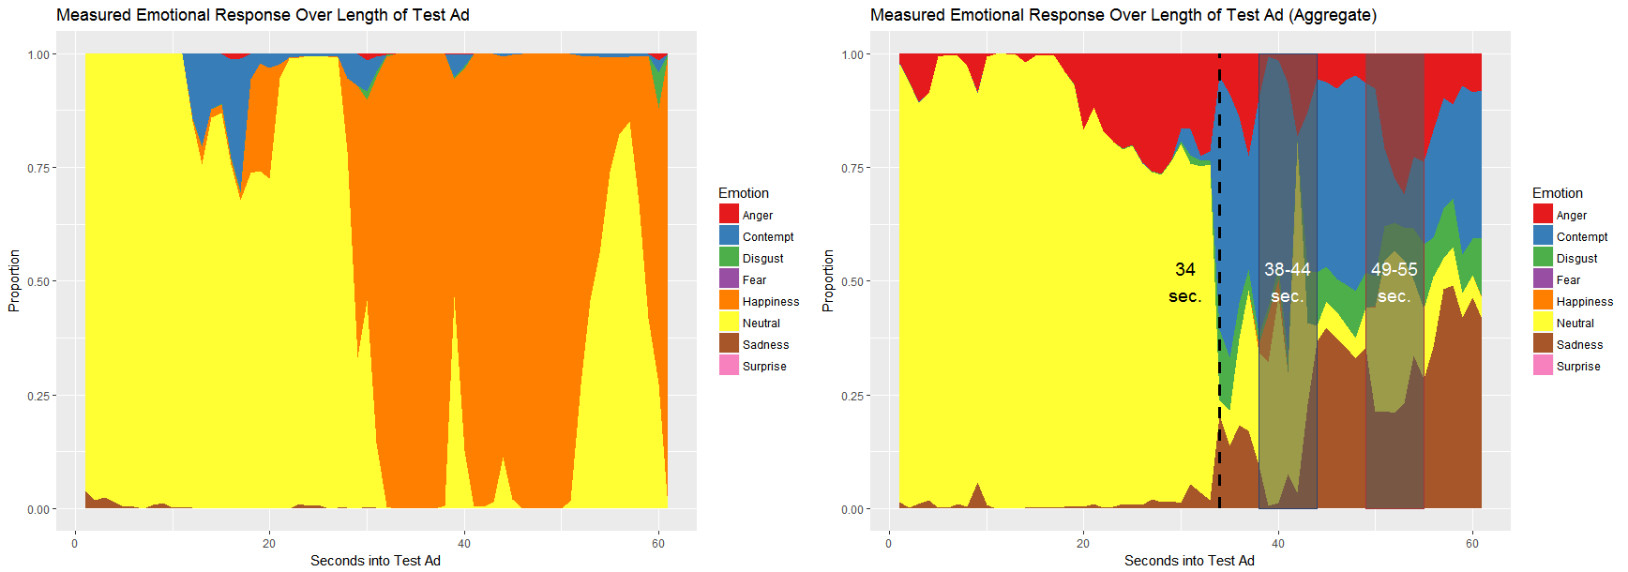
On the left is the chart for a single participant while on the right is an aggregate of several participants. You can see how different people experience different emotions by the way there isn’t one clear emotion that is strongly represented on the right side.
I picked a few sections to look at closer. I chose these somewhat subjectively just to simplify the discussion. In a real-world scenario, additional analysis would be necessary to identify points of interest.

First, notice that up until about 34 seconds in the ad isn’t really garnering any particular emotion. This is, of course, the spot when our leading lady shows her true colors. After this point it seems most of the participants are experiencing some emotion — even if Emotion API is still in its infancy, just knowing that a potential audience is experiencing something might be better than not knowing at all. Your ad is eliciting a reaction (whether the intended one or not). This also means that the first 34 seconds of ad content (more than half the total run time) may have places that can be removed without losing impact. While local ads (as in our example) won’t break the marketing budget in most cases, the larger the ad’s audience the greater the savings that could be achieved by “cutting the fat.” Most 30-second national ads can cost six figures.

Between 38 and 44 seconds, we see “Contempt” represented strongest although not as large a proportion as we saw at the 34-second mark (the initial shock has worn off maybe). Although the commercial is clearly going for a comedic angle, the audience appears to be more upset than anything else. Whether this is because of what’s going on in the bathroom or the still-unanswered-question about whom the popcorn eater is on the couch spying on our couple remains unanswered. Ironically, the two emotions I would expect the Los Angeles Film Festival intended to elicit, “Happiness” and “Surprise”, are never the highest proportion emotion the algorithm identifies…and “Surprise” doesn’t even appear!

At 49 seconds we finally see who the ad is for and audiences return to a more “Neutral” state. Although Microsoft suggested classification based only on the highest proportion the algorithm identifies, it is hard not to find other high proportion emotions interesting such as “Anger.” At the 55 second point, we see the final conclusion is met with apparent “Sadness.” Maybe they feel bad that our clueless leading man is about to get more than he bargained for tonight? Or maybe it’s because Emotion API can’t quite identify the overarching emotion felt by our participants because it’s still a new technology — either way, remember that research is a process of building knowledge using multiple approaches, not drawing conclusions from a single methodology.
Tying it Together
The session is followed by a brief survey where we ask participants to describe how they felt about the ad (we’ve revealed to them at this point which ad we were testing). The idea here is to add a third level of validation to the study: the first being the “benchmark” videos, the second the test video, and the third the conscious, self-reporting of experienced emotions. It becomes interesting to see whether participants’ reported feelings match what Emotion API told us.
Together, these measures can be combined to “smooth” the data and make up for any shortfalls in Emotion API’s calculation.
How does this marriage of deep learning classification and research succeed?
- Focused: We focus on a single ad and a single question about that ad. Although I presented several possibilities of analysis, you’d typically want to generate an application statement like the following:
The Los Angeles Film Festival will use this research to determine optimal television ad content (decision/action) to decrease length/cost without sacrificing impact (outcome) for the 2017 festival (product/service) among Millennials in Los Angeles County (target group).
- Actionable: The research is actionable because Emotion API allows us to see second-by-second wherein the ad we need to improve/cut/etc. We don’t have to rely on a survey solely as the means of data.
- Measurable ROI: By identifying parts of the ad that can be removed (if that is the goal of the study) then measuring ROI is easy — simply determine the cost-per-second for the audience (e.g. local, regional, national, etc.) and how many seconds you can cut. Divide that by your investment in the study and you should have a rough estimate of ROI.
- Engaging: The methodology of emotion recognition alone is usually enough to pique the interest of research buyers and executives jaded on the typical pedestrian approaches to market research reporting. However, there are other interesting ways to present findings. For instance, using R package, “Shiny,” we can create an application to show the progression of emotions in real time along with the ad. You then can see precisely when emotions change along with the ad. Sometimes one of the best ways to engage a research audience is by letting them play with the data themselves.
A Final Word
Let me say that I love these new kinds of research methodologies and I’m an early adopter (you haven’t picked up on that yet?). That being said, I cannot emphasize enough that these technologies are still very new and cannot be treated as a be-all/end-all solution! They need more development and validation before they are to be considered as a gold standard.
Some remaining questions:
- Sample considerations
- Emotion API only captures eight emotions but clearly there are far more nuances in human emotion than just eight. Are these relevant too?
- Is there a latent variable to be accounted for in the vein of The Hawthorn Effect? How would we adjust for this (or can we)?
The research, analytics, and big data industries are becoming one in the same. This is just one example of what is sure to come in the future.

Recent Comments